What Is a Software Development KPI?
Key performance indicators (KPIs) are metrics that measure whether your software development process adheres to its goals. Basically, it shows how well the software development team is performing.
It’s important to pick the right software metrics. Surprisingly enough, this is where many businesses stumble.
For example, lines of code, number of deploys, and number of updates may sound like reasonable KPIs to people not directly involved in software development. But they don’t reflect anything meaningful in practice. Especially when it comes to Agile development, which is popular nowadays.
In this guide, we’ll talk about what KPIs you should actually use, why they are important, and how you can benefit from them.
Have a software project in mind? Contact us for a free consultation!
Why Are Metrics Important?
Metrics are necessary to see how close you are to meeting an objective. So setting KPI for software development ensures that the project is delivered on time, on budget, and with satisfactory quality.
KPIs provide valuable context for identifying, tracking, and prioritising problems. Having a clear indication of where the team falls short also provides good motivation to improve that particular area. All this results in more organised processes and better return on investment (ROI).
Types of KPI in Software Development
Key performance indicators can be broadly categorised into 3 types.
Customer Metrics
Customer KPIs help measure customer satisfaction with the software product. These can include:
- retention – how long the customer is willing to engage with the product;
- number of customers gained (or lost);
- customer lifetime value (CLV) – the worth of long-term customer relationships and identifies the most profitable channel for your business;
- customer acquisition cost (CAC) – how much it costs you to attract new customers to the product;
- and so on.
These metrics are a good way to determine not just the quality of the application, but also of your marketing efforts.
Financial Metrics
Companies track their income and expenses like taxes, interest payments, and depreciation to measure profits. So the common financial KPIs include:
- working capital – the amount of money the company has to spend on its operations;
- operating cash flow – an indicator of how efficiently the company can spend money on its operations;
- monthly recurring revenue (MRR) – expected monthly revenue;
- annual recurring revenue (ARR) – expected yearly revenue;
- average sale price (ASP) – the average price of a product sold to a single customer;
- net profit margin – the actual profit the company generates;
- and others.
These KPIs help companies budget, track their most and least lucrative practices, and manage their money more effectively over the course of the software development life cycle.
Performance Metrics
Performance KPIs are used to measure the efficiency and productivity of different departments. These metrics can account for:
- department performance;
- team performance;
- individual performance;
- average time it takes to complete a task;
- average cost of completing a task;
- and much more.
They are essential to building an effective development process. But we’ll talk about them in more detail down below.
Benefits of Choosing the Right KPIs
Quality performance requires constant monitoring. And it’s only natural to track progress accurately on a commercial project. Some of the obvious benefits of that include:
- development process optimisation;
- improved planning;
- easy to spot weak points;
- streamlined error management and problem solving;
- objective idea of how well the project is progressing;
- ability to analyse and iterate workflow patterns;
- predictability of future outcomes.
Generally speaking, KPIs offer a great reference point for monitoring the company’s health as a whole. There’s no factual telling of how profitable or well-organised a business is without them.
Possible KPI Metrics for Software Development
You need to choose your KPIs wisely. Tracking the wrong metrics is useless at best and misleading at worst. So which KPIs should you use in software development? Let’s have a look at ones that will actually come in handy.
Development Velocity
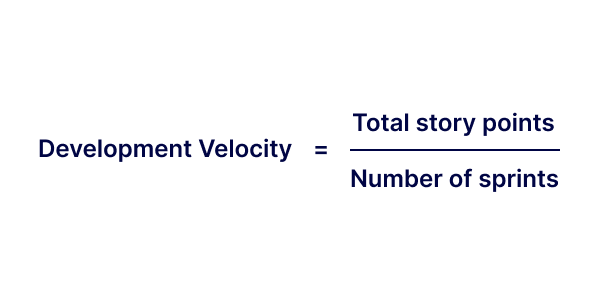
Development velocity is the amount of work the team can do in a single sprint.
Sprints are a key part of the wildly popular Agile approach to bespoke software development. The whole development process is split into smaller cycles – that is, sprints. One sprint is a couple weeks long at most and comes with a list of clearly defined tasks.
Each task is assigned 1-10 story points depending on the estimated amount of resources it requires. The amount of all story points determines the intensity of a sprint.
So, to calculate your average development velocity, you need to add up the story points of all the sprints within the time period that interests you and divide it by the number of sprints.
This KPI will help you:
- realistically plan your workload;
- accurately estimate the time needed to complete projects;
- measure team productivity by comparing your past and current velocities.
Sprint Burndown
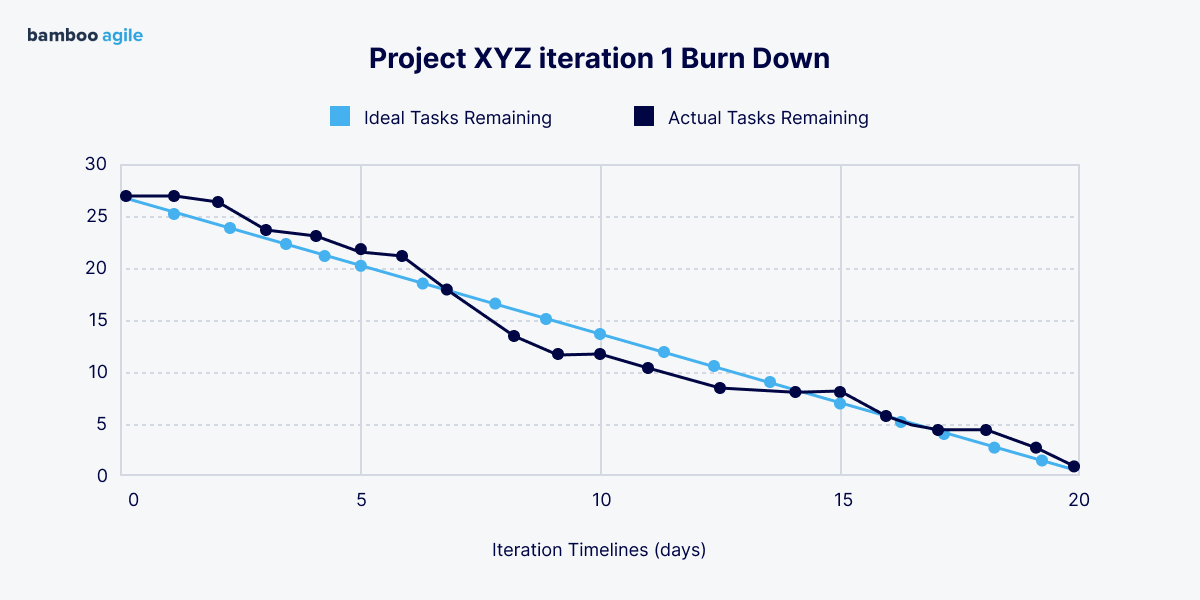
Sprint burndown shows the amount of work already completed and left to do. Ideally it should be an even, linear progression of time spent and tasks completed. Of course, that’s not always the case.
Sprint burndown is most commonly represented by a chart that looks something like this:
This KPI will help you:
- track team performance;
- find which tasks require more (or less) time;
- make better estimates in the future.
Release Burndown
Release burndown is similar to a sprint burndown, but instead of one sprint, it covers the entire project. The simplest burndown chart will look similar to this:
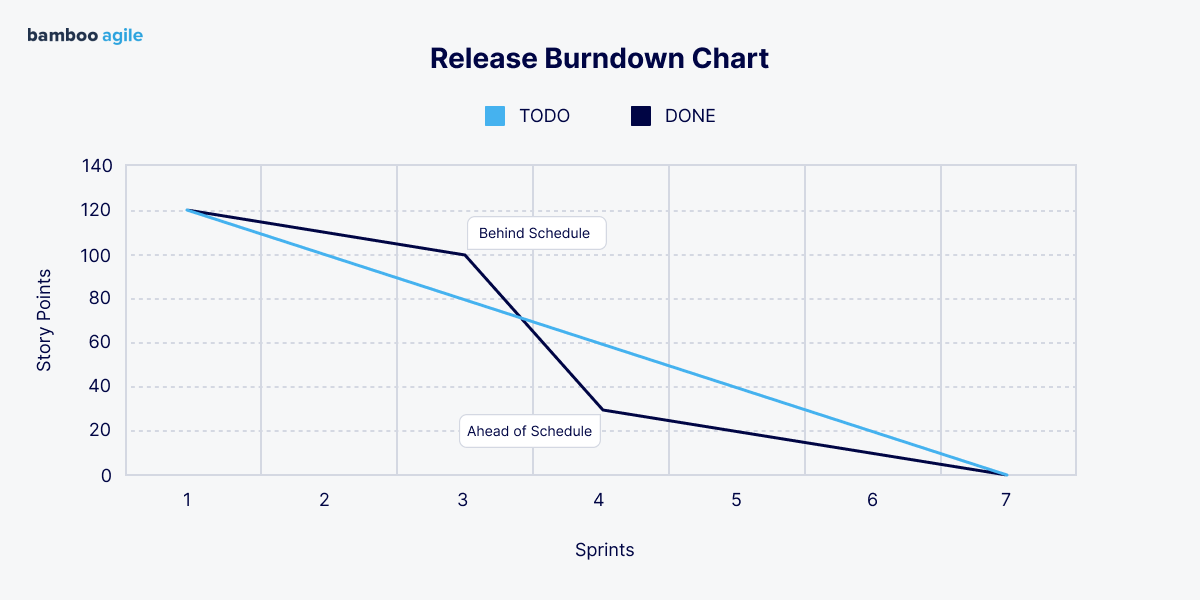
As you can see, it shows the relationship between the number of tasks completed and the number of sprints required for that.
This KPI is useful for:
- calculating the number of sprints a project needs;
- distributing the workload between sprints;
- determining release dates.
Cycle Time
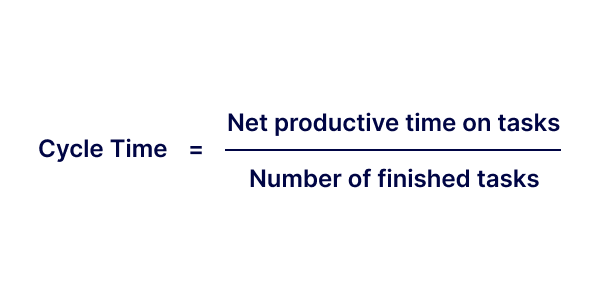
Cycle time shows when a single task is likely to be completed. Just divide the net time spent on task completion by the number of finished tasks.
Knowing the average time it takes to complete a task will help you:
- improve sprint planning;
- measure the team’s growth by comparing past and current data;
- determine which types of tasks take longer.
Cumulative Flow
How many times have you seen tasks piling on, forever stuck in that in-progress limbo? This KPI prevents exactly that.
Cumulative flow reflects the status of all current tasks. It’s usually presented as a chart that shows the distribution of tasks across different stages. For example, it can look like this:
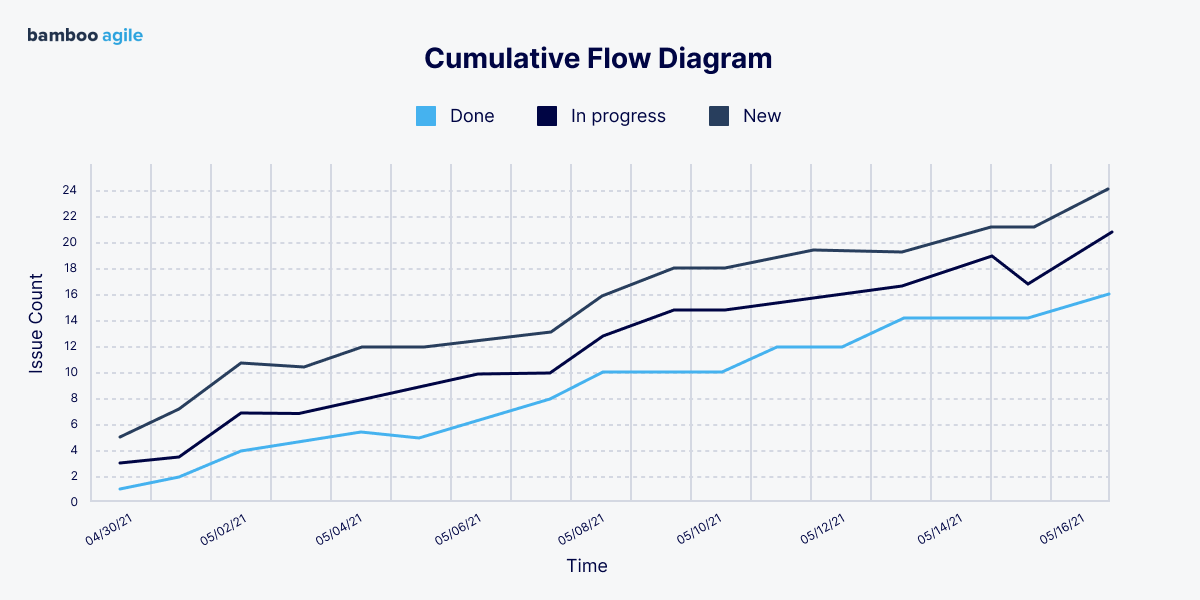
This provides a great way to monitor the team’s output and ensure consistency in task completion. It also gives a direct visual for the amount of work that should be completed before moving onto less urgent tasks.
All in all, this KPI allows you to:
- improve output;
- minimise multitasking;
- develop a culture of finishing work that was already started.
Flow Efficiency
Flow efficiency, a key performance indicator, reveals the time remaining until project completion. It’s basically the difference between the time remaining and the amount of work in progress.
You can calculate it using this formula:
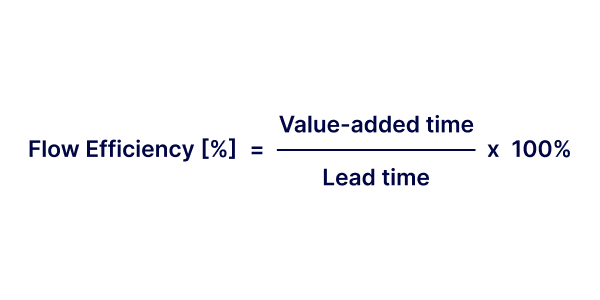
Value-added time is the time spent straight-up working. Lead time is the total cycle time, which is a combination of value-added time and the time spent on waiting for stuff to happen (for feedback or documentation, for example).
Flow efficiency will help you:
- pinpoint areas of weakness;
- improve project management;
- provide valuable insights into the allocation of work among different waiting periods.
Code Coverage
Code coverage determines the extent to which your code was exercised during testing. It can be measured via several different metrics:
- Line coverage. The amount of source code tested (by lines of code).
- Statement coverage. The number of statements executed.
- Branches coverage. The number of control structure branches (i.e. if statements) executed.
- Function coverage. The number of defined functions that received calls.
- Condition coverage. The number of boolean sub-expressions tested for a true/false value.
These are often represented by three values: the number of items tested, the number of items in your code, and the code coverage percentage.
The latter is calculated with the following formula:
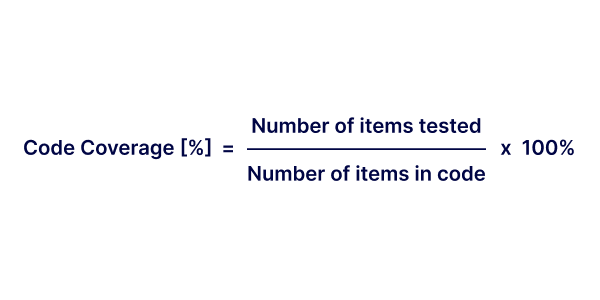
100% code coverage does not mean all the code has been comprehensively tested. However, it does suggest that you have evaluated the core of the codebase and the most important features of the project.
So, this KPI lets you:
- assess test-driven development practices;
- monitor continuous delivery.
Code Stability
Stable code means that making updates or changes to it won’t cause damage to the product or the business using it. It’s not a very easy KPI to measure. Some do it by charting the frequency of changes in the code, like so:
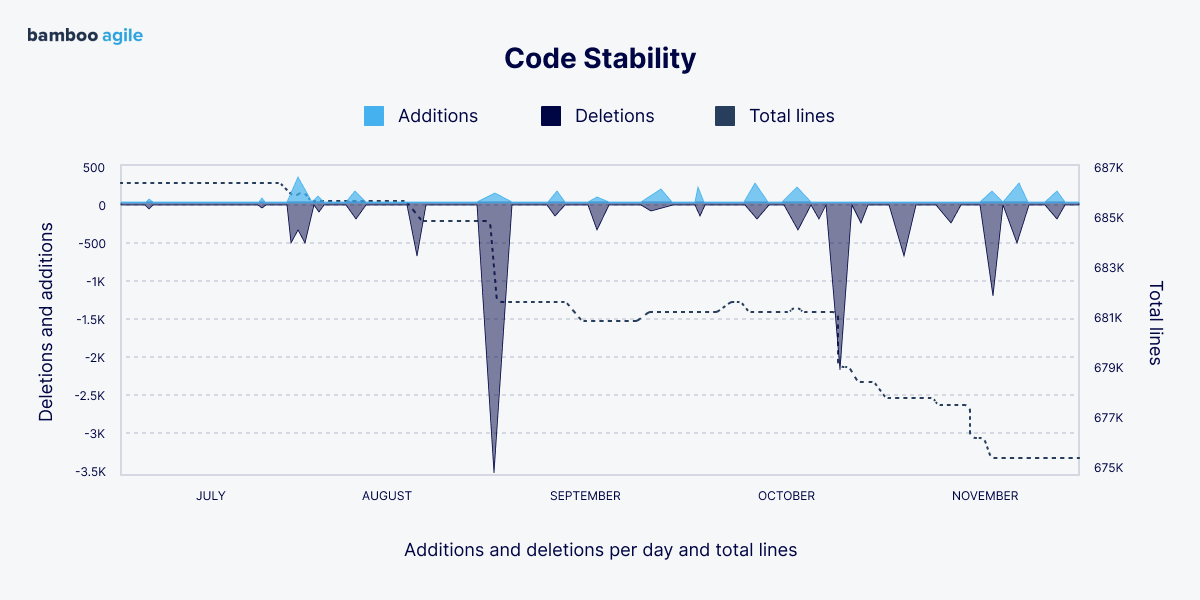
Others measure it by seeing what percentage of the code deployed creates downtime.
Regardless, the metric is very helpful for:
- determining the quality of the product;
- ensuring system stability;
- finding weaknesses in the code.
Code Simplicity
Code simplicity goes hand in hand with code complexity. Both KPIs are measured via a number of different metrics. These can include:
- the number of paths the code needs to take before completion;
- the number of callbacks;
- general readability;
- and others.
Having a simpler code is beneficial both for the application’s performance and the people working on it. For one, it makes onboarding significantly easier.
All in all, code simplicity will help you:
- boost error tracking and management;
- simplify onboarding;
- increase performance speed.
Code Churn
Code churn measures how often a developer throws out code (functions, files, classes) within the first 2-3 weeks of writing it.
The KPI itself is fairly simplistic, however, it provides a good metric for evaluating the stability of your code. By looking at the patterns in file changes over time, you can identify a variety of issues. Those tend to coincide with spikes in code modification.
They’re easy to see on a graph. Here’s an example that tracks lines of code (though you can be more specific by tracking changes by file, class, function, branch, etc.):
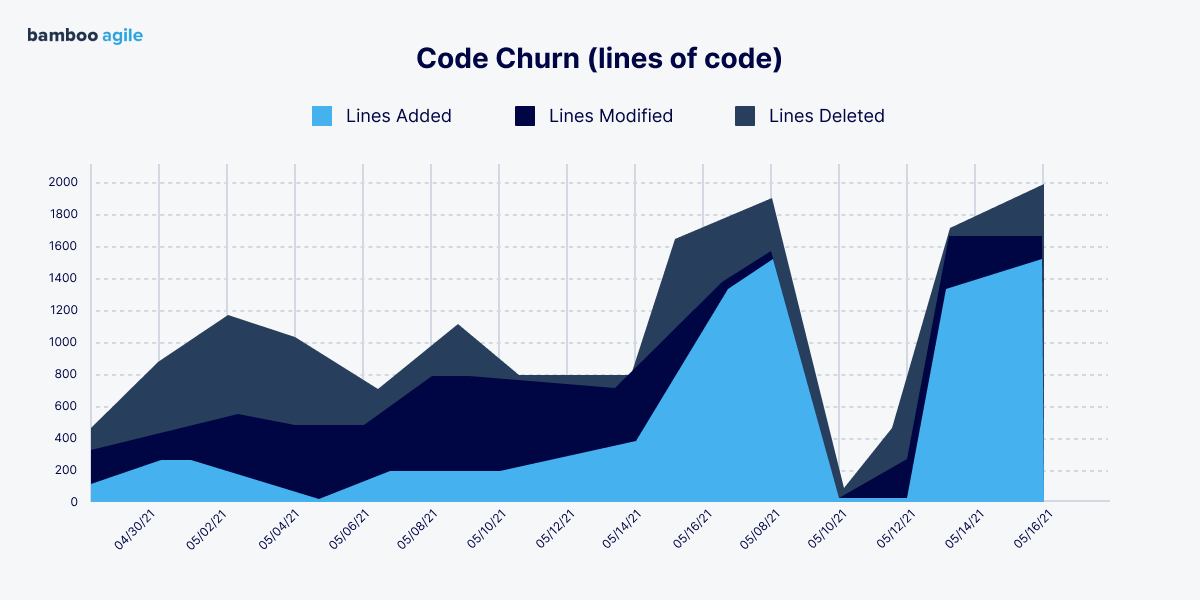
Different team members will have different churn rates. It also varies with experience, projects, and the team’s general workflow. So there’s no one hard standard for code churn. That said, excessive and sudden spikes in code churn are often a sign of trouble.
So, this KPI is useful for:
- monitoring update activity;
- tracking errors to their source;
- ensuring the stability of the final product.
Pull Request [PR] Size
A pull request (PR) is when a developer initiates the process of merging new code changes with the main project after reviewing them. It’s also often called a merge request. Essentially, it’s a way for developers to indicate that they have finished coding and that the code is now ready for review and merging.
The pull request size KPI measures the number of pull requests that have been reviewed and merged into the ongoing project trajectory over a period of time. To ensure smooth operation, it is important to keep the PR size low by regularly reviewing certain code segments.
Ideally, a single pull request should take no more than 4 days. And in the world of DevOps, you should strive for a PR size of less than 250 changes. An increase in PR size may lead to delays in the cycle time and low productivity.
Tracking the PR size KPI will let you:
- improve development speed;
- monitor code quality in a more organised manner;
- increase efficiency.
Net Promoter Score
Net promoter score (NPS) reflects the likelihood of a client recommending your product to others. It provides a far more detailed insight into the matter compared to ratings and reviews on the product page. NPS should be measured on a regular basis via customer surveys and data analysis.
Tracking this KPI is a great way to:
- measure customer loyalty;
- discover ways to increase customer satisfaction;
- minimise customer churn.
Dashboards & Tools to Track
You don’t have to stick to Google Sheets, Charts, and whatnot to track all of your KPIs. The market offers plenty of specialised tools for recording and analysing KPI data. The most popular ones today are PowerBI and Oracle Analytics – let’s have a quick look at both.
PowerBI

Microsoft Power BI is a solution generally meant for KPI visualisation. It can draw data from a huge number of sources, including Web ones. It can also be used in tandem with other Microsoft products, such as SharePoint Lists and Microsoft Forms for automatic data visualisation.
One of Power BI’s biggest advantages is the cost. It’s a very affordable toolkit that even has a free tier with the most basic functionality. Though, keep in mind that the software can lag when working with large amounts of data.
Oracle Analytics

Oracle Analytics is a cloud platform for generating charts, dashboards, and reports. It can gather data from numerous sources, as well as organise and clean it. Oracle also utilises machine learning to provide more accurate analytics.
One downside is that the app isn’t very user friendly. To be more specific, some users may find the dashboard difficult to navigate and clunky in general. That said, you can always reach out to the built-in help centre if you have any questions.
How We Set Up KPIs at Bamboo Agile

We used to employ very complex equations back in the day to calculate the smallest KPIs – the exact number of major bugs, the exact number of minor bugs, things like that. But today, our 3 main project KPIs are cost, quality, and time. They are best represented by a venn diagram – you can’t have all three at once, but you can try and get as close as you possibly can.
— Sergey Zubovich, the CEO of Bamboo Agile

Within those three, the team singles out quality and delivery as especially important factors.
- Quality is measured by the absence of negative feedback from the clients and customers. It can also be used in a narrower sense to judge the quality of the code, for example, using such metrics as: number of rejected pull requests, number of recommendations after code reviews, number of code failures after deployment, etc.
- Delivery is determined by the team’s ability to successfully finish sprints. In other words, to provide all the agreed upon deliverables on time.
Of course, there are still many smaller, more specific KPIs used on a regular basis. For instance, Bamboo Agile project managers have their own KPIs, the main ones being:
- Client feedback. Similarly to the big quality metric, measures the amount of criticism from the client.
- Team health. Ensures there is no burnout, no low morals, no toxicity – these can be contagious and as such, require special attention.
- Product understanding. Makes certain everyone on the team knows and understands the product to the necessary extent.
The team doesn’t use anything fancy to track these metrics.
“Our main tool for KPI tracking in Jira,” says Sergey. “It can generate various reports with burndown charts, task analytics, and many other progress metrics we need to monitor. Combined with Google Sheets, it meets all of our KPI requirements.”
The Importance of KPIs in Software Development: Illustrated by Cases
Facebook is a company that heavily relies on tracking KPIs to measure user engagement, advertising effectiveness, and revenue growth. Their ability to monitor and analyse customer metrics has allowed them to continuously refine their platform, target ads more effectively, and stay ahead of competitors.
Similarly, such services as Spotify put great effort into analysing customer metrics to constantly improve their recommendation algorithms and usability.
After taking over as the CEO of Twitter in October 2022, Elon Musk laid off roughly 50% of the workforce, allegedly naming lines of code written (a famously terrible KPI) as one of the factors for the decision. Regardless of whether that actually was a driving KPI behind the mass layoff, the action had resulted in a huge drop of revenue for Twitter.
Hundreds of brands pulled their advertising from the platform, including General Motors, Audi, United Airlines, and many others. The website faced performance issues, an influx of bots, and a general drop in customer satisfaction. As of today, Twitter has lost $20bn in value since Musk’s purchase in October last year – a decrease of over 50%.
All this can be easily traced back to misjudging the efficiency of software team members, stability of the code, user attitude, and the platform’s marketability.
Netflix
At the start of 2023, Netflix initiated a password sharing crackdown in an attempt to increase the number of subscriptions. And it backfired horribly. In just the first 3 months after implementing the rule, the platform lost more than 1 million users in Spain alone.
Dominic Sunnebo, the global insight director at Kantar’s Worldpanel Division, states, “The loss of a million users, even if most weren’t paid subscribers, would be a blow to Netflix in terms of word of mouth recommendation for its shows and service.”
The password sharing crackdown implied not only higher fees for people sharing their passwords, but also a hard limitation on the number of devices one account could be accessed from. The latter was especially detrimental, as one of the main draws of the service was its accessibility from anywhere in the world.
All in all, this is another example of seriously misunderstanding customer metrics and looking at the wrong KPIs. Netflix essentially sabotaged the reasons for why and how their service gained popularity in the first place.
Conclusion
KPIs are an essential part of software development. By selecting the right metrics, such as code quality and customer satisfaction, teams can make data-driven decisions, identify bottlenecks, and optimise processes. Still, approach KPIs as guides rather than sole measures of success. Regular review and refinement are necessary to align metrics with evolving business goals.
Bamboo Agile has two decades of software development experience behind its belt. If you need advice on which KPIs to use for your software project, drop us a line to get a free consultation with our specialists.


